
What is AI Box Plot Generator
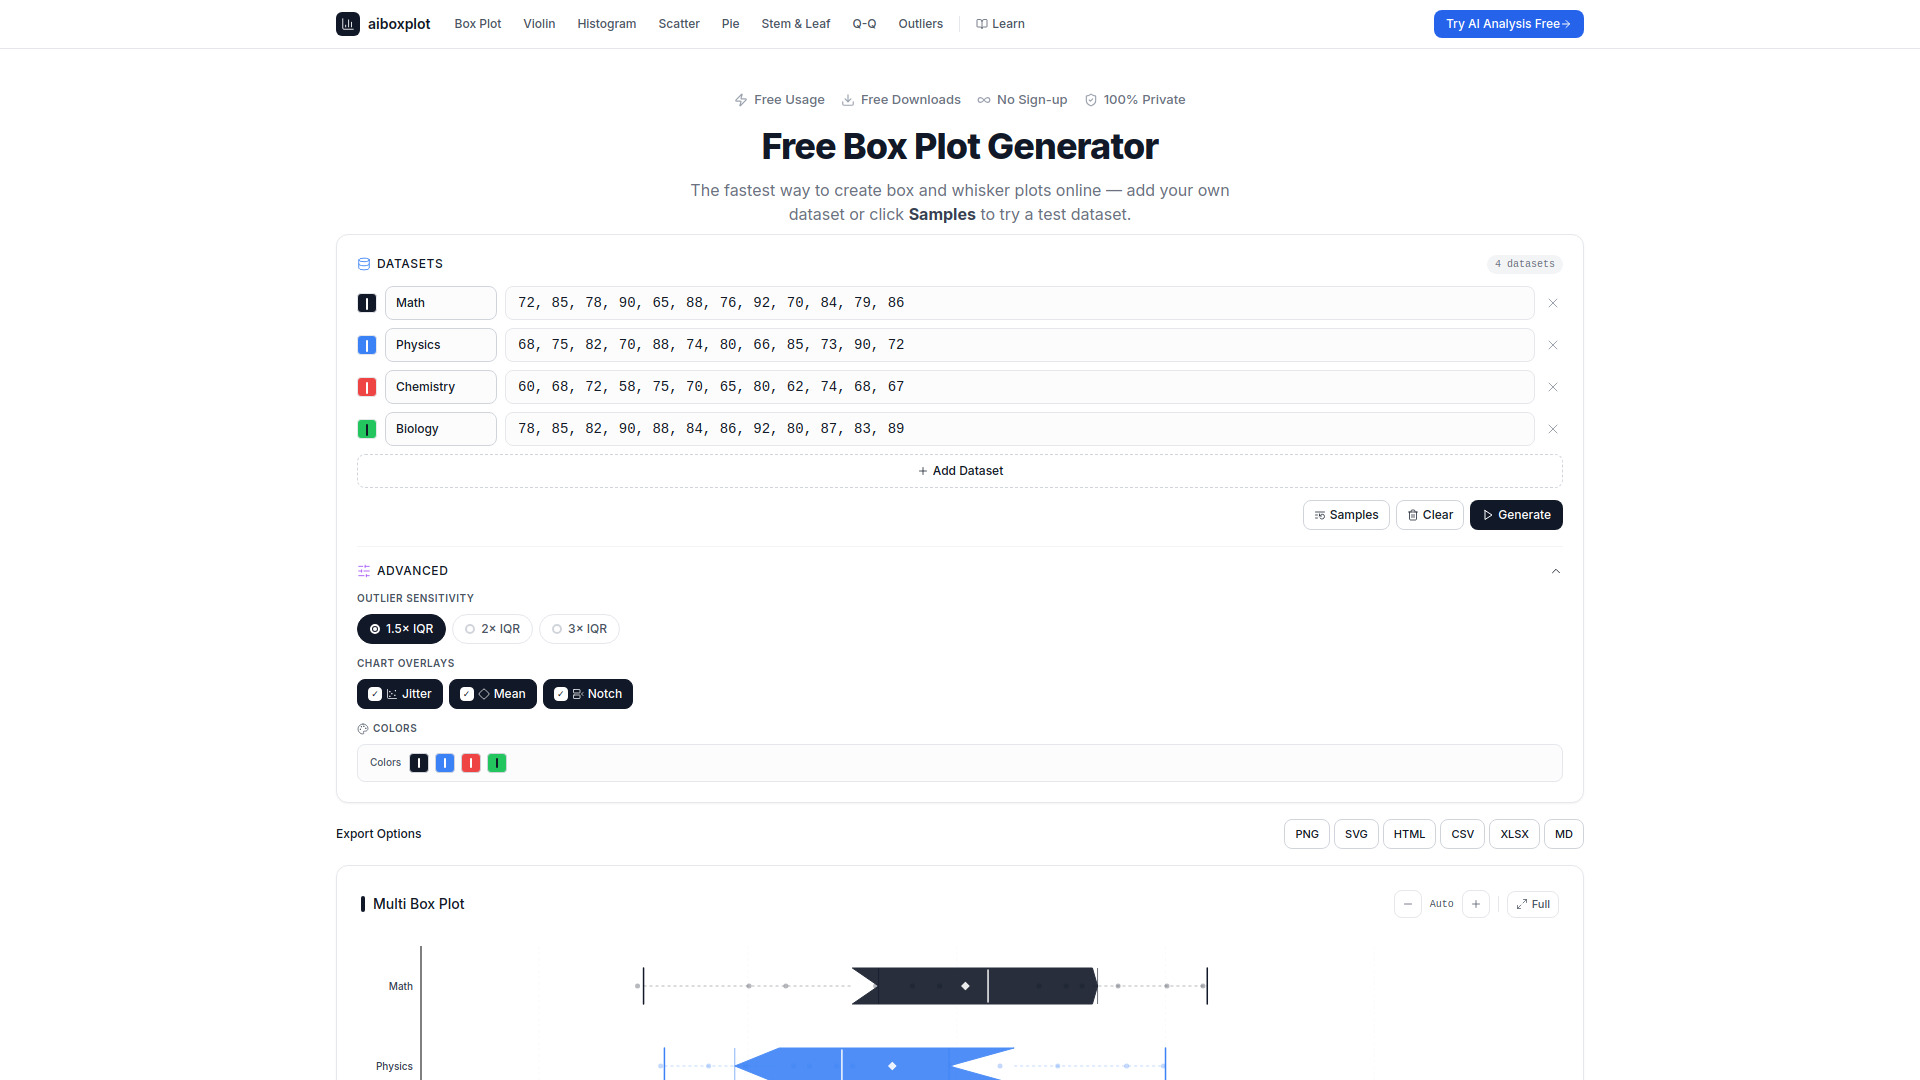
AI Box Plot Generator is a free online tool that allows users to create box and whisker plots quickly and easily. It supports multi-dataset comparison, outlier detection, and export to various formats including PNG, SVG, CSV, XLSX, HTML, and Markdown. The tool operates entirely client-side, ensuring data privacy, and includes AI-powered analysis for statistical insights.
How to use AI Box Plot Generator
- Enter your data: Type or paste numbers separated by commas, spaces, or line breaks directly into the tool.
- Add multiple datasets: Click the '+' button to add up to 10 datasets, each with its own color and label.
- Customize your chart: Use the Advanced panel to adjust outlier sensitivity (1.5×, 2×, or 3× IQR), toggle overlays like jitter, mean, and notch, and select colors.
- Generate the plot: Click the 'Generate' button to instantly compute the five-number summary and render the chart.
- Export results: Download the chart as PNG, SVG, CSV, XLSX, HTML, or Markdown with one click, with no watermarks.
- Get AI analysis: Click 'AI Analysis' to access the full tool with AI-powered statistical insights and recommendations.
Features of AI Box Plot Generator
- AI-Powered Analysis: Provides instant statistical insights, distribution summaries, and actionable recommendations.
- Multi-Dataset Comparison: Compare up to 10 datasets side-by-side with independent colors, notch displays, and jitter scatter overlays.
- Outlier Detection: Uses Tukey fences (1.5× IQR) with adjustable sensitivity (2× or 3× IQR).
- Customizable Overlays: Toggle jitter, mean markers, and notch displays.
- Export Options: Download charts as PNG, SVG, CSV, XLSX, HTML, or Markdown, all watermark-free.
- 100% Client-Side Privacy: All computation runs locally in the browser; data never leaves the device.
- No Sign-Up Required: Free to use with no account creation.
- Responsive Design: Works on mobile, tablet, and desktop devices.
Use Cases of AI Box Plot Generator
- Students & Teachers: Create box and whisker plots for homework, statistics assignments, and classroom demonstrations.
- Data Analysts & Scientists: Quickly visualize distributions during exploratory data analysis and compare multiple datasets.
- Researchers & Academics: Generate clean, watermark-free plots for papers and presentations, with high-resolution PNG or editable SVG exports.
- Business Professionals: Track KPIs, compare team performance, and visualize survey results for reports.