
What is RowSpeak
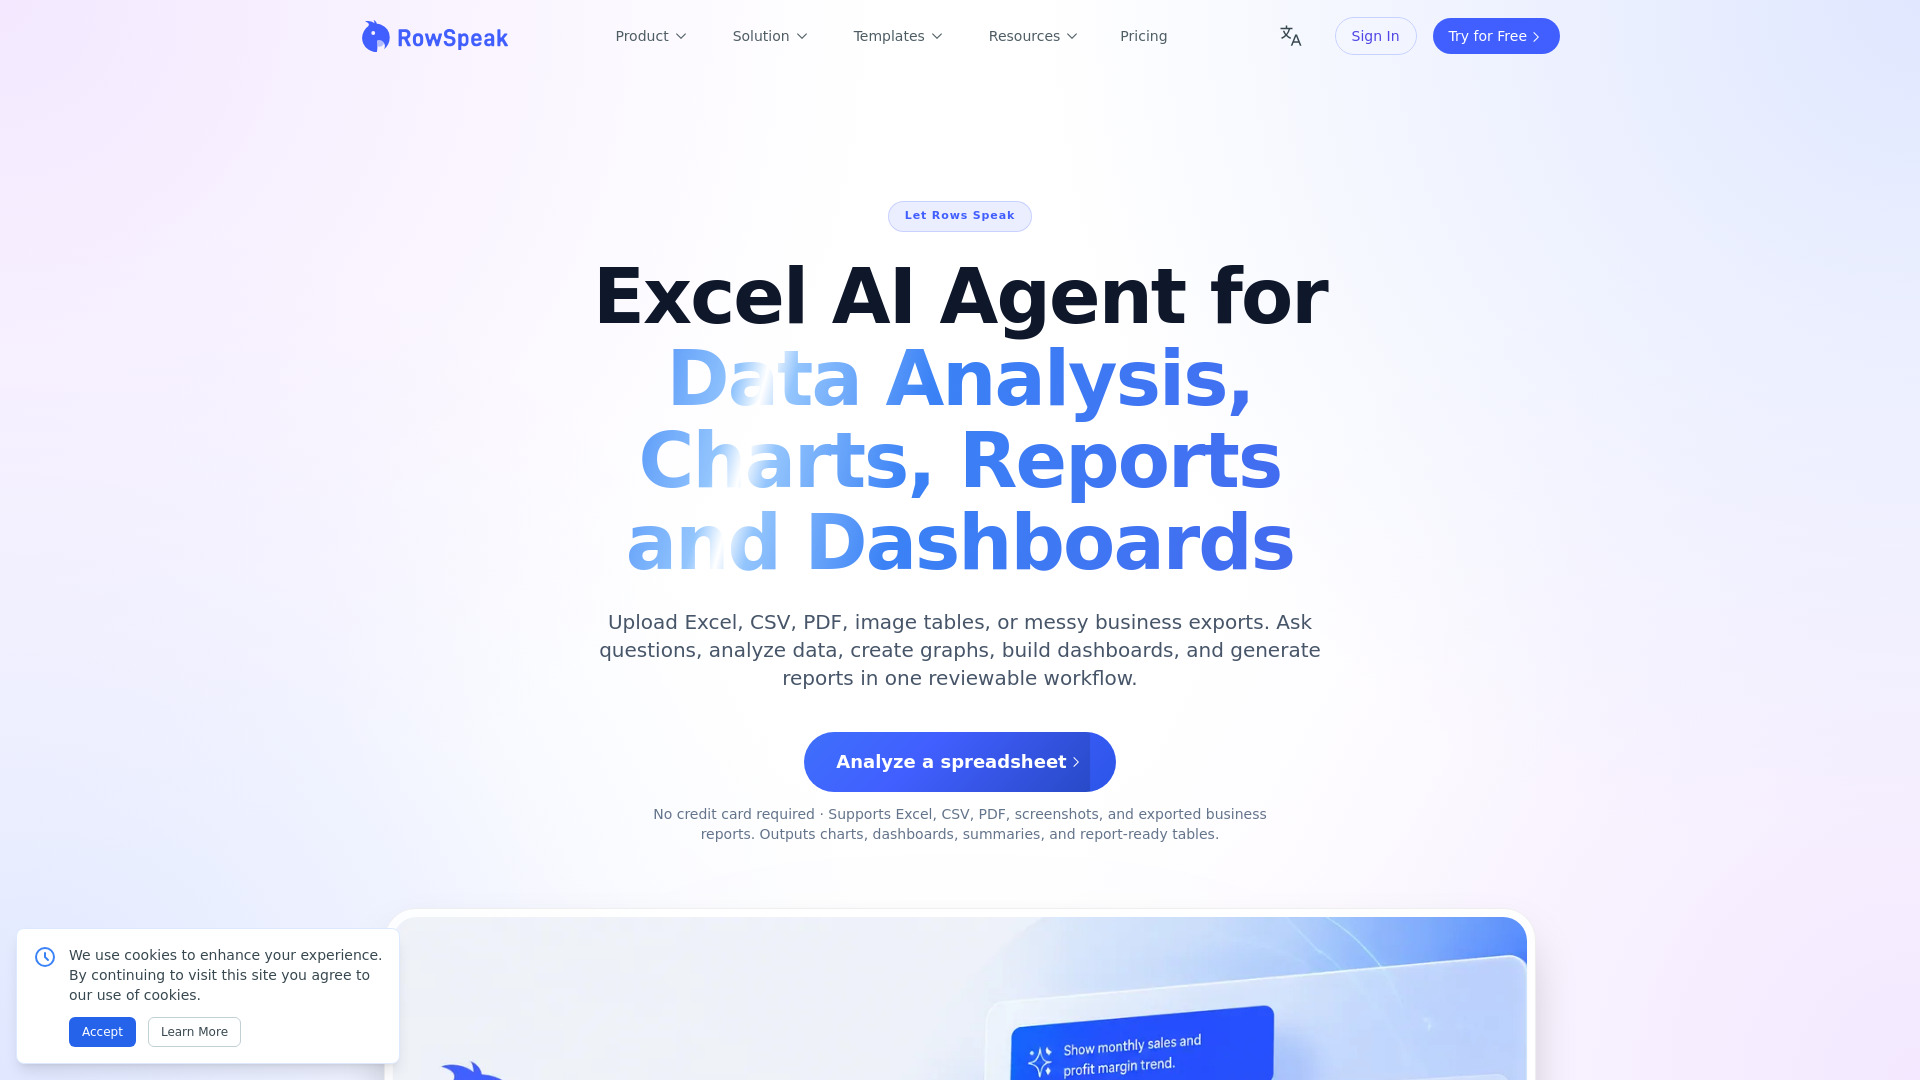
RowSpeak is an AI agent designed for spreadsheet-heavy workflows. It helps users analyze messy Excel, CSV, PDF, and image-based tables using natural language. Users can clean data, calculate metrics, create charts, build dashboards, and generate report-ready summaries—all in one reviewable workflow.
How to use RowSpeak
- Upload your data: Upload Excel files, CSV exports, PDF tables, screenshots, image-based tables, or paste data directly.
- Choose a task: Select from options like AI Graph Maker, AI Data Analysis, Excel to Dashboard, or AI Report Generator.
- Ask in natural language: Describe what you want to do—analyze trends, create charts, explain changes, or generate summaries.
- Review and refine: RowSpeak produces outputs you can inspect, edit, and share.
Features of RowSpeak
- AI Graph Maker: Create bar charts, line charts, pie charts, KPI visuals, and data visualizations from uploaded files or pasted data.
- AI Data Analysis: Ask questions in natural language to identify patterns, compare historical data, and explain changes without formulas or pivot tables.
- Excel to Dashboard: Turn Excel and CSV exports into dashboard-style KPI views with charts, summaries, and structured metrics.
- AI Report Generator: Generate report-ready summaries, variance notes, management updates, and decision briefs from messy business files.
- File Conversion: Convert image tables to Excel and PDF tables to Excel in one click.
- AI Spreadsheet Generator: Create spreadsheet templates using natural language.
- Multi-format Support: Works with Excel, CSV, PDF tables, screenshots, image-based tables, and pasted data.
Use Cases of RowSpeak
- Finance and Accounting: Automate financial workflows, management reporting, budget vs. actual analysis, and revenue forecasting.
- Marketing & Growth: Build AI-powered marketing automation strategies.
- Supply Chain & Inventory: Understand inventory status, flow, and changes.
- Sales & E-commerce: Faster forecasting and clearer revenue insights.
- General Business Analysis: Analyze messy business exports, create charts, dashboards, and reports for leadership.
FAQ
What is an Excel AI agent? An Excel AI agent is an AI system that helps you work through spreadsheet tasks end to end. RowSpeak can read Excel, CSV, PDF tables, and pasted data, then help clean fields, calculate metrics, create charts, explain changes, and generate reusable analysis outputs.
Can RowSpeak work as an AI graph maker? Yes. You can upload Excel or CSV files, paste a table, or use extracted PDF table data, then ask RowSpeak to create bar charts, line charts, pie charts, KPI visuals, and other business-ready graphs.
Can RowSpeak turn Excel into a dashboard? Yes. RowSpeak can turn Excel exports and CSV files into dashboard-style KPI views with key metrics, visuals, and structured outputs.
How is RowSpeak different from ChatGPT for Excel? ChatGPT is a general-purpose AI assistant, while RowSpeak is built for spreadsheet-heavy workflows—focusing on file upload, data structure, metric calculation, graph generation, assumption review, and reusable business reporting.
How is RowSpeak different from Excel Copilot? Excel Copilot works inside Microsoft Excel. RowSpeak is designed for broader business files and workflows, including Excel, CSV, PDF tables, image tables, pasted data, charts, dashboards, and report-ready summaries.
Can RowSpeak analyze PDF tables or image tables? Yes. RowSpeak can extract structured data from PDF tables, screenshots, and image-based tables, then turn them into charts, summaries, and business insights.
What data sources can I upload? You can upload Excel files, CSV exports, PDF tables, screenshots, image-based tables, and pasted data.
Is RowSpeak a BI tool? RowSpeak is not a traditional BI tool. It is lighter and faster for file-based analysis workflows where teams need to turn data into insights, graphs, dashboards, and reports without building a full BI stack.
Can RowSpeak replace pivot tables for quick analysis? For many quick analysis tasks, yes. RowSpeak can summarize data, group categories, compare segments, create charts, and explain changes without manually building pivot tables.
Can RowSpeak identify patterns in historical data? Yes. RowSpeak can analyze historical data to surface trends, seasonality, anomalies, segment changes, and other patterns.